Mutual Funds
Do Passive Funds Win in India? Not So Fast, SPIVA


A counter-narrative to SPIVA India Year-End 2025, built from a direct + growth fund universe as of 31 Dec 2025.
Every time a new investor comes to Otto Money, one conversation inevitably happens: active vs passive funds for India exposure. Because we don't work on commission, our stand stays the same. Passives let you take market exposure without betting on variables you can't control, like fund-manager skill, style drift, or key-person risk. If you want to remove that uncertainty, passives are the way to go. If you want optionality and a shot at outperformance, active funds still work in India.
Recently an investor pointed us to the SPIVA India report as evidence that the debate is settled, that passives win, full stop. SPIVA (S&P's "Indices Versus Active" scorecard) is a serious, widely-cited piece of work, and we take it seriously. But "settled" didn't match what we were seeing in client portfolios. So we rebuilt the scorecard ourselves and looked hard at where our answer diverges from theirs. Here's what we found.
What we measured
We scored every active, direct-plan, growth-option scheme across five SEBI categories as of 31 December 2025 against their AMFI Tier-1 benchmarks minus the cost of investing.
We found several gaps in how SPIVA’s report for India was built. We break that down after charts.
Chart 1: the scorecard says passive doesn't win "across the board"
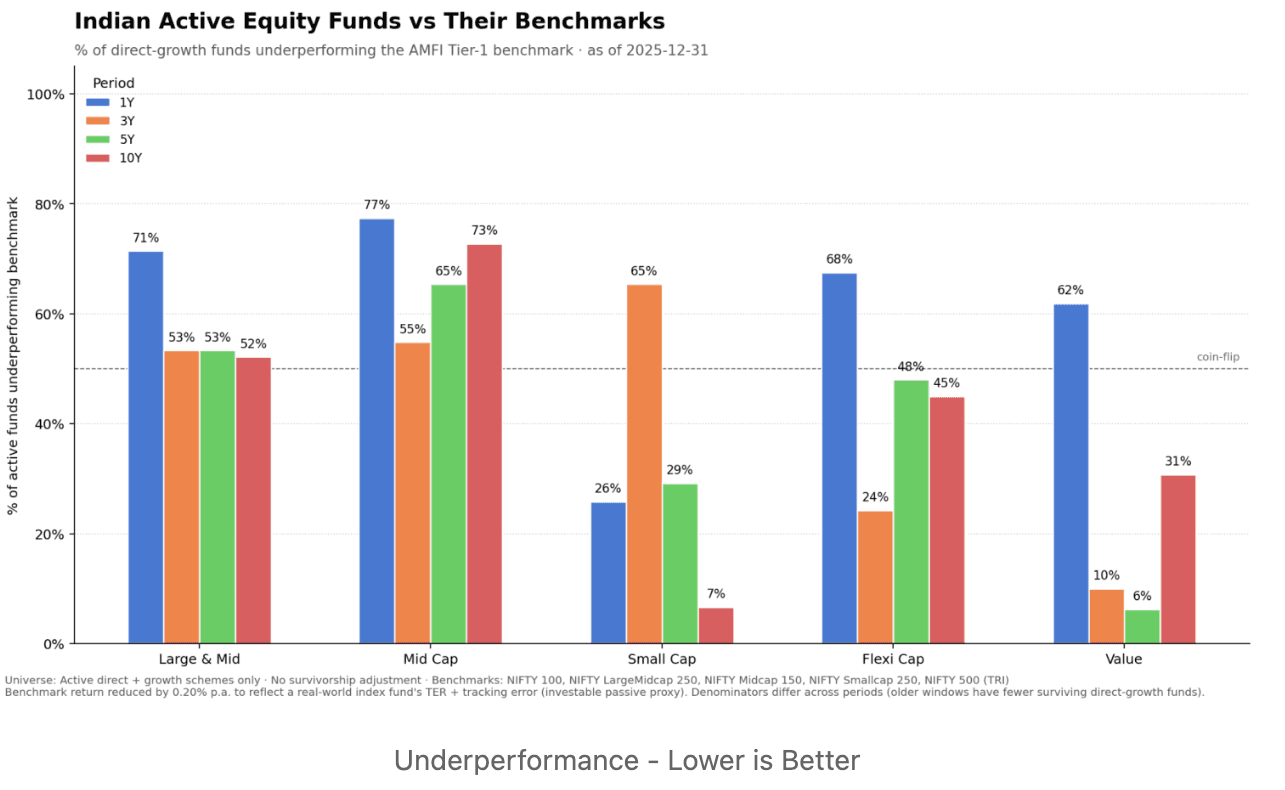
The dashed line at 50% is the coin-flip. If active management were pure noise, the bars would cluster around it. They don't. They fan out by category, and that fanning is the whole story.
Mid Cap is the honest win for passive. It sits above the coin-flip in every window and gets worse with time: 65% of mid-cap funds underperform at 5 years, 73% at 10. If someone wants a clean "just buy the index" case in India, this is it, and we won't pretend otherwise.
Small Cap is the mirror image at long horizons. Yes, there's a rough 3-year window where 65% underperform, but stretch it to 10 years and only 7% of small-cap funds lag the investable index, which means 93% beat it. That isn't noise. It's a structural feature of a large, under-researched universe where stock selection still pays.
Value is the other standout. At 3 and 5 years, just 10% and 6% of value funds underperform. Value investing in India has had a genuinely strong run, and active managers captured it.
Large & Mid and Flexi Cap hug the coin-flip. Large & Mid is a near-tie over the long run (52 to 53% underperform at 3, 5 and 10 years) after a weak 1-year reading of 71%. Flexi Cap actually tilts active at 3 years, with only 24% underperforming, and stays just under the coin-flip at 5 and 10. In these categories the median fund roughly matches the index, and your outcome comes down to selection rather than the active-or-passive label.
So the honest reading of this chart isn't "active wins" or "passive wins." It's that the answer is category-dependent, and a single headline number flattens away the most useful information an investor has.
Chart 2: dispersion shows where the benchmark sits inside the pack
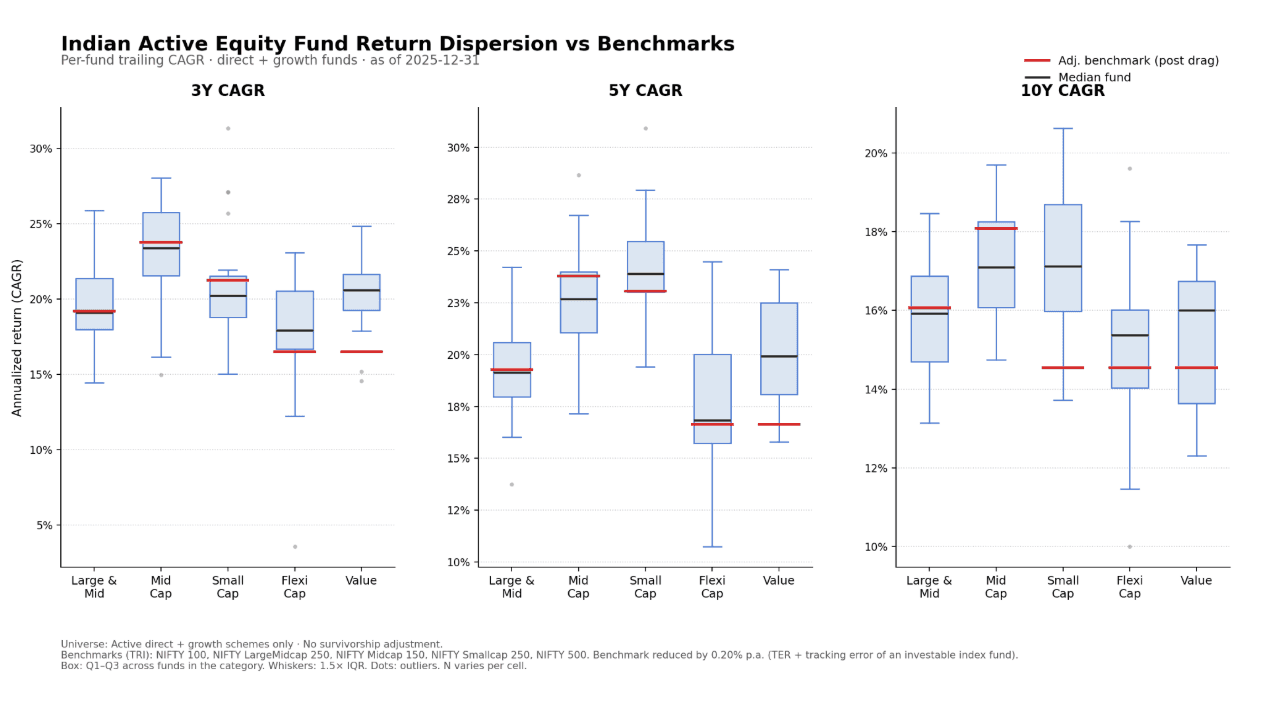
This second chart is the one we'd actually put in front of a client. Each box is the middle 50% of funds in a category (Q1 to Q3), the black line is the median fund, and the red line is the investable benchmark after the cost haircut. The question is simple: where does the red line fall relative to the box?
At 3 years, the red line cuts through the top half of the box for Mid Cap and Small Cap, so most funds sit below it. For Value, the red line sits at the very bottom of the box, meaning even a below-median value fund beats the index.
At 5 years, Small Cap's median fund pulls clearly above the red line, and Mid Cap's benchmark still rides at or above the median. Flexi sits right around its benchmark, with a wide box signalling high dispersion - manager choice matters there. Value, by contrast, keeps its benchmark down near the bottom of the box, consistent with only 6% of value funds underperforming.
At 10 years, the divergence is starkest. For Small Cap, the red line drops to the bottom whisker, so nearly every surviving fund cleared the investable index. For Mid Cap, the red line sits above the median, which confirms the scorecard: the typical mid-cap fund lost to its index over a decade. Value funds pull the median well above the index - indicating value tilt and patience being rewarded. However, Value at 5Y is exceptional - so beware of the recency trap.
The practical takeaway from dispersion is the part SPIVA's single percentage can't show you. In categories like Small Cap and Value, even a mediocre pick tended to beat the index. In Mid Cap, you needed to be in the top tier just to keep up. That's the information that should drive an allocation decision.
Spotlight on SPIVA’s report and how we fixed it
SPIVA’s India 2025 year end report has gaps. Below is a list and how/why we corrected for the gaps.
1) They include all funds, not just Direct-Growth variants.
Fix : We use Direct-Growth variants as that is what we use and is the cleanest read of fund performance without commissions.
2) They benchmark Large cap funds against an unfair index.
Fix : SPIVA's flaw: they score large-cap funds against a large+mid index (the S&P India LargeMidCap, top 85% of market cap) — broader than the funds' own SEBI-mandated benchmark, the Nifty 100. Large-cap funds must hold 80%+ in large caps, so in a midcap-led decade like this one they're penalised for not holding midcaps they're forbidden to own. That's an unfair yardstick. We could have swung the other way and used the pure Nifty 100 TRI, but funds that do use their 20% latitude would beat it on the midcap tailwind alone - flattering active. So instead of forcing a benchmark onto a category that straddles the line, we move to one that fits: Large & Midcap funds (≈50/50 by mandate) scored against the matching Nifty LargeMidcap 250 TRI.
3) Fund performance is post fee and expenses and benchmarks are not.
Fix : We applied a 0.2% fee (average drag of index funds) to the benchmark to see investor outcomes. In other words, we're comparing active funds not to a costless index, but to an investable passive alternative. That's the fair fight.
4) They club small and midcap together.
Fix : We break these down since the universes are quite different and India uses separate Midcap and Smallcap funds.
5) They treat all closed schemes as underperforming, while that’s not true in India.
Fix : Most closures in India are maturities, mergers or regulatory - not failures. Details in a later section.
6) They don’t show flexi-cap and Value funds at all.
Fix : This is where we invest and we look past the “cap” style. Investors deserve to get this view.
The survivorship question, which is the big one
SPIVA's scorecard treats every fund that closed or merged during the period as an underperformer. That's a reasonable guard against survivorship bias in the US, where funds genuinely get shut down for chronic underperformance. We looked at the Indian record and don't think the assumption travels.
Of ~80 "dead" direct-growth schemes we traced, roughly 38 were close-ended series funds that simply reached their scheduled maturity (ICICI Pru Value Fund 1 to 20, Sundaram Top 100 Series I to VII, and similar). They were designed to end. Around 14 died from regulatory events: the roughly 10 RGESS funds killed when the tax break was withdrawn in 2017, and 4 Sahara schemes force-liquidated when SEBI revoked the AMC's licence in 2015. Roughly 20 were mergers where investors simply continued in the surviving scheme (L&T into HSBC, Principal into Sundaram). A handful were structural plan mergers after SEBI's 2018 single-plan rule.
The number of funds where an investor got their money back early, at a loss, after years of underperformance and had to redeploy? Approximately zero. In India, the "disappearance" of a fund almost always means continuity or scheduled maturity, not the investor loss that SPIVA's adjustment is designed to capture. Applying the US-style penalty to the Indian consolidation pattern looks tidy, but we'd argue it's materially misleading.
Caveats, stated plainly rather than buried
We hold these in plain sight. This is direct + growth only, so it flatters returns versus regular-plan investors who pay distributor trail, which is rather the point, because it's the modern retail experience. It is survivorship-naive, which is defensible for India for the reasons above, but you should know it's a choice.
So, active or passive?
Passive still deserves the default seat for most investors, most of the time. It removes a layer of uncertainty, and in Mid Cap it simply wins. But "passive always wins in India" is overstated. For a direct-plan investor with a long horizon and a stomach for selection risk, Small Cap and Value active funds have been beating the investable index, decisively and persistently. The right benchmark, the right plan, and an honest treatment of fund closures all move the needle back toward active by more than the headline suggests.
The real lesson isn't "active" or "passive." It's that the question only has a useful answer once you ask it one category at a time. This is not an endorsement of anyone’s ability to pick the right funds - but a comparison of active fund management skill.
Methodology: active direct + growth schemes, as of 31 Dec 2025; AMFI Tier-1 TRI benchmarks reduced 0.20% p.a.; survivorship-naive. Not investment advice. Otto Money does not earn commission on fund recommendations.
Disclaimer: Advice on Otto Money is provided by Wealth Beacon Investment Advisors (SEBI Reg. No. INA000020749). This is not investment advice - please consult a qualified Investment Advisor.